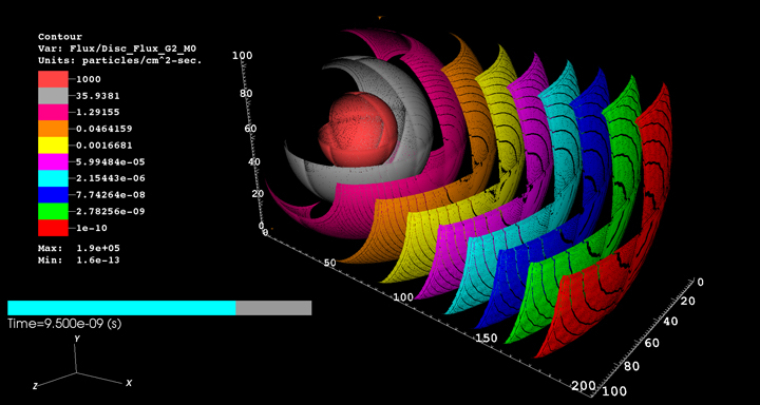

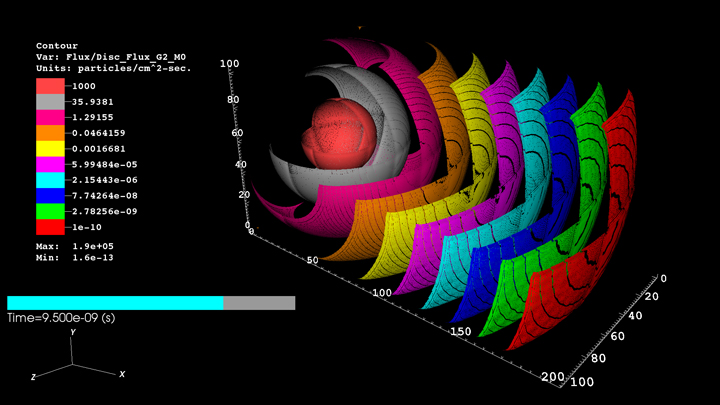
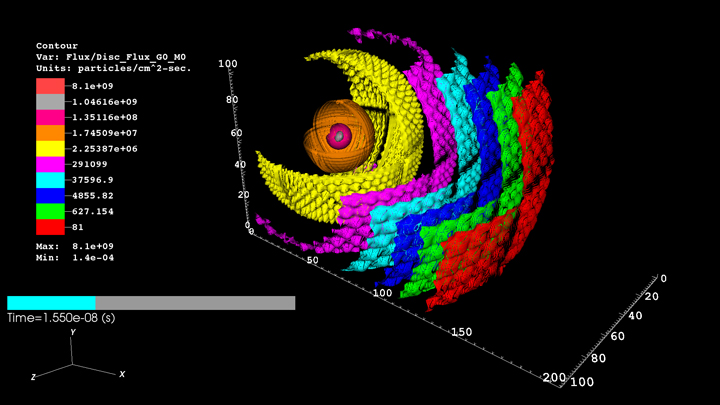
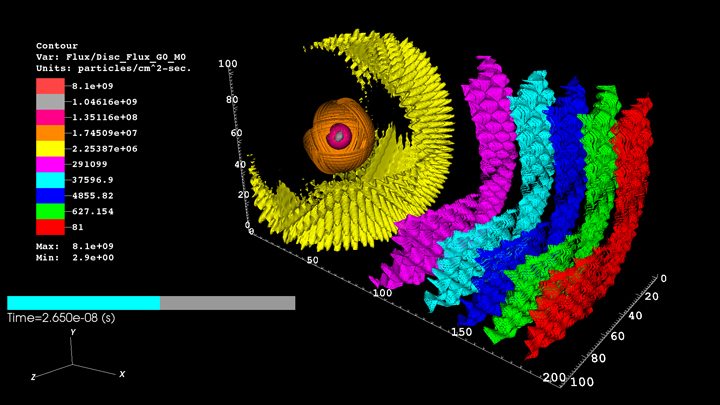
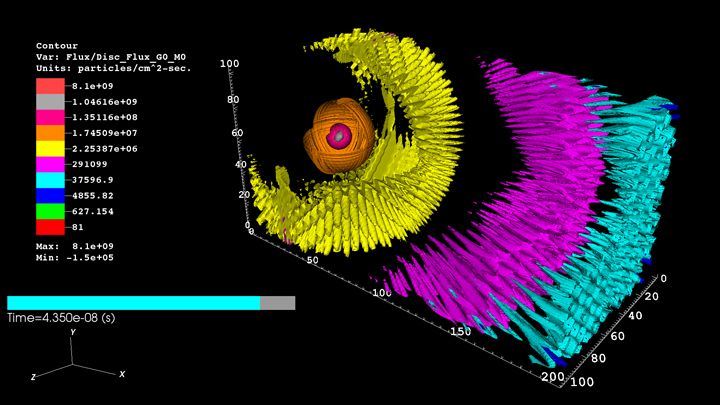
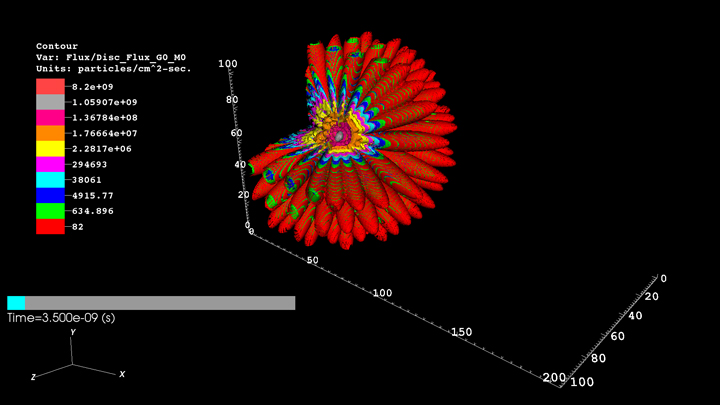
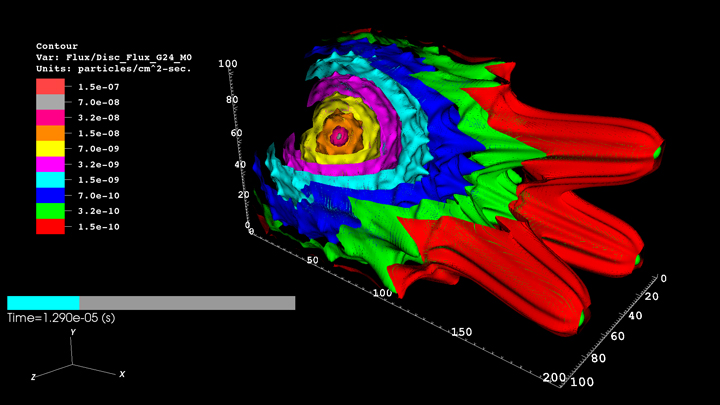
Neutron Density Plots
We use PDT, a parallel deterministic transport code developed at Texas A&M University, to simulate neutrons in a graphite block. We plot contours of the computed neutron densities (n/cm2-s) at select points in time using VisIt. The pictures show a block of graphite cut out to show the center. There is a source of fast neutrons in the center-left of the block.
While real neutrons can travel at any speed less than the speed of light and in any direction, simulated neutrons are forced to travel in a finite number of discrete directions and at averaged speeds. This discretization is required to map the continuous transport equation onto a form efficiently solvable by computers. The angular and energy discretizations introduce numerical error.
We are interested in a class of error known as “ray effects” that occur because neutrons only travel in discrete directions (or rays). This leads to the spikiness of the contours plotted above, which should be spherical shells. The fast neutrons show prominent ray effects, even when a large number (over 8000) of angles are used. As these neutrons collide with simulated carbon nuclei in the block, they slow down. The slow neutrons inherit ray effects from their fast progenitors.